Ready in minutes
AI builds your ad from a single prompt

June 21, 2025
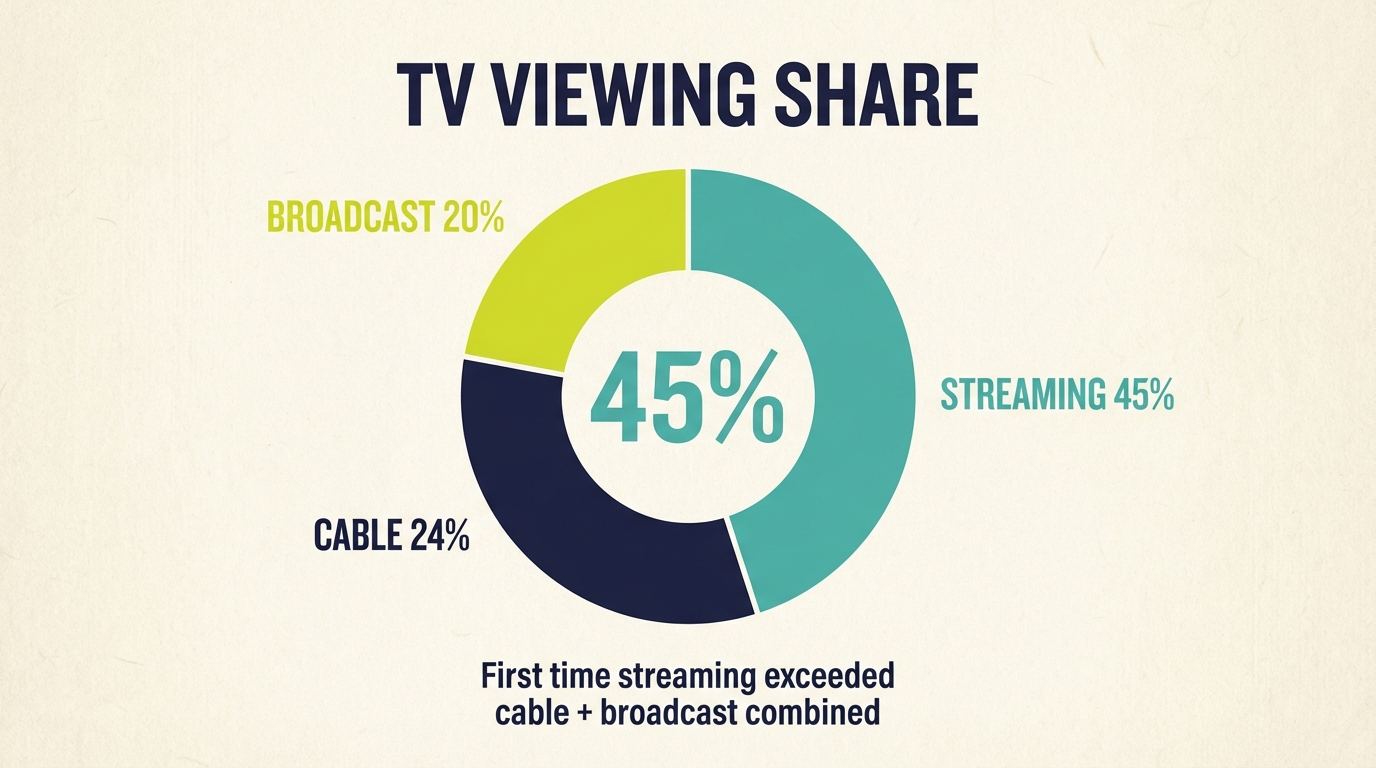
Streaming now accounts for 45% of TV viewing versus 24% for cable. The shift continues.
45%
Streaming's share of total TV viewing (May 2025)
24%
Cable TV's share of total viewing (down from 34% in 2020)
71%
Streaming viewing growth since 2021
Streaming now accounts for approximately 45% of total U.S. TV viewing time, while cable represents about 22% and broadcast television about 20%, according to Nielsen's Gauge reports for 2025. In a historic milestone reached in May 2025, streaming viewership (44.8%) exceeded the combined total of broadcast (20.1%) and cable (24.1%) television for the first time, according to Nielsen. This represents a fundamental shift in how Americans consume television content and has profound implications for advertisers.
The balance of power in television has shifted decisively. What began as a niche alternative to cable has become the dominant form of television viewing in American households. For businesses planning their advertising strategies, understanding this shift is essential. Cable advertising, once the default for local and regional advertisers, now reaches a shrinking audience, while streaming offers growing reach and increasingly accessible advertising options.
This transformation creates unprecedented opportunities for businesses of all sizes. Where cable advertising required substantial budgets and long-term commitments, connected TV advertising through streaming platforms allows businesses to start campaigns with budgets as low as $50, reaching audiences on the platforms where they actually spend their viewing time.
The viewing share numbers tell a clear story of streaming's ascendance and traditional TV's decline.
Based on Nielsen's Gauge data and industry reporting:
Streaming: 44-47% of total TV viewing
Hit record 44.8% in May 2025
July 2025 saw continued growth
Includes Netflix, YouTube, Hulu, Prime Video, Disney+, and dozens more
Growing share month over month
Cable: 22-24% of total TV viewing
Down from highs of 30%+ just a few years ago
Continues steady decline
Sports and news remain strongest categories
Aging audience demographic
Broadcast: 20-21% of total TV viewing
Relatively stable compared to cable
Live events, news, and network series
NFL and major events drive spikes
Generally older audience
Other (DVD, gaming, etc.): 8-10%
Includes gaming console use
DVD/Blu-ray playback
Other connected device usage
According to StreamTV Insider's analysis, May 2025 marked a watershed moment:
Streaming: 44.8% of all TV viewing
Cable + Broadcast combined: 44.2%
First time streaming exceeded traditional TV combined
Netflix streaming hours reached 7.5% alone
YouTube maintained top streaming position at 12%+
This wasn't a temporary spike. The underlying trend has been clear for years, and this milestone represents streaming's permanent position as the dominant form of television viewing.
The shift toward streaming has accelerated:
Streaming share growth:
2021: ~27% of TV viewing
2022: ~34% of TV viewing
2023: ~38% of TV viewing
2024: ~41% of TV viewing
2025: ~45%+ of TV viewing
Cable share decline:
2021: ~35% of TV viewing
2022: ~31% of TV viewing
2023: ~27% of TV viewing
2024: ~24% of TV viewing
2025: ~22% of TV viewing
Streaming has gained approximately 18 percentage points of share since 2021, while cable has lost roughly 13 percentage points. Broadcast has declined more gradually, losing 5-7 percentage points over the same period.
Within streaming, viewership is distributed across multiple platforms:
Top streaming platforms by TV viewing share:
YouTube: 12-13% of total TV viewing
Netflix: 7-8% of total TV viewing
Hulu: 2-3% of total TV viewing
Amazon Prime Video: 3-4% of total TV viewing
Disney+: 1-2% of total TV viewing
Peacock: 1-2% of total TV viewing
Max (HBO): 1-2% of total TV viewing
Other streaming: 15%+ combined
YouTube's dominance is notable. The platform alone commands more viewing share than many cable networks combined, making it a critical advertising platform.


Understanding who watches what helps advertisers make informed decisions about where to invest.
Cable viewers tend to be:
Older (median age 55+)
Higher income (legacy subscribers)
More likely to watch news and sports
More likely to live in suburban/rural areas
Often maintaining service for specific channels (ESPN, local news)
Streaming viewers tend to be:
Younger (median age 35-40)
All income levels (but higher adoption among higher incomes)
More likely to watch entertainment content
Urban and suburban concentrations
More tech-savvy, cord-cutters or cord-nevers
Broadcast viewers:
Oldest demographic (median age 60+)
Concentrated around major events (Super Bowl, Oscars, news)
Strong local news viewership
Over-the-air antenna users growing
These demographic differences have significant implications for advertisers. If your target customer is under 50, streaming is increasingly where you'll find them.
Morning (6 AM - 12 PM)
Broadcast leads with morning news shows
Cable news draws substantial audiences
Streaming lower but growing (background viewing)
Daytime (12 PM - 5 PM)
Streaming competitive with cable
Cable maintains daytime programming audience
Broadcast lowest during midday
Early evening (5 PM - 8 PM)
Local and national news boost broadcast/cable
Streaming begins prime-time surge
Family viewing decisions favor streaming
Prime time (8 PM - 11 PM)
Streaming dominates decisively
Cable and broadcast split remaining
Highest total viewing hours
Late night (11 PM - 2 AM)
Streaming very strong
Late-night shows split cable/broadcast
Younger audiences heavily streaming
For advertisers, streaming's prime-time dominance is particularly significant because this is when the most viewers are watching and when advertising delivers the greatest impact.
Viewing share fluctuates seasonally:
Summer months:
Streaming share typically highest
Cable/broadcast drop without regular programming
July 2025 saw streaming reach new highs
Fall (September-November):
Broadcast and cable recover with new seasons
NFL drives significant broadcast viewing
Streaming maintains strong position
Winter holidays:
Mixed viewing patterns
Special programming boosts traditional TV
Streaming grows with gift subscriptions
Q1 (January-March):
Super Bowl spike for broadcast
Otherwise streaming-favorable
March Madness boosts cable/broadcast temporarily
Streaming adoption varies by region:
Urban areas: Highest streaming share (50%+)
Suburban areas: Near national average
Rural areas: Lower streaming share due to broadband limitations
Coastal markets: Higher streaming adoption
Midwest/South: More cable retention
For local TV advertising, geographic targeting through streaming allows advertisers to reach specific markets regardless of these regional variations.

The shift from cable to streaming has direct implications for advertising strategy and budget allocation.
As viewership shifts, advertising inventory follows:
Cable advertising challenges:
Declining audience size
Older demographic skew
Scattered across hundreds of channels
Minimum commitments often $5,000+
Long lead times for placement
Streaming advertising advantages:
Growing audience size
Younger demographic access
Better targeting capabilities
Lower minimum budgets ($50 on some platforms)
Real-time optimization
For small business TV advertising, the streaming shift means more opportunity, not less. The same premium TV advertising that was once reserved for major brands is now accessible through platforms like Adwave.
The cable vs. streaming split affects how you reach different customer segments:
To reach older consumers (55+):
Cable news (CNN, Fox News, MSNBC) still relevant
Broadcast network programming
But even this demographic is shifting to streaming
To reach middle-aged consumers (35-54):
Balanced approach needed
Streaming increasingly dominant
Some cable sports and news viewing
To reach younger consumers (18-34):
Streaming is essential
Cable reach is minimal
YouTube particularly strong
To reach families with children:
Streaming dominates (Disney+, YouTube, Netflix)
Limited cable consumption
Broadcast for special events only
The economics of cable vs. streaming advertising differ significantly:
Cable advertising:
CPM: $5-15 (lower CPMs reflect smaller, older audiences)
Minimums: Often $2,000-5,000 per month
Production: Separate cost, $5,000-50,000
Targeting: Limited to DMA and daypart
Measurement: Nielsen estimates, limited attribution
Streaming/CTV advertising:
CPM: $20-35 (premium inventory, better targeting)
Minimums: As low as $50 on some platforms
Production: Free with AI tools like Adwave
Targeting: ZIP code, demographics, interests, behaviors
Measurement: Precise impression counts, completion rates
While cable CPMs are technically lower, streaming often delivers better ROI due to targeting precision and audience quality. Paying $25 CPM to reach your exact target audience beats paying $10 CPM to reach a broader, less relevant audience.


The cable-to-streaming shift creates specific opportunities for advertisers who adapt their strategies.
If you're currently advertising on cable, consider reallocating budget to streaming:
Why shift:
Growing audience on streaming
Better targeting reduces waste
Lower barriers to entry
More flexible buying
How to shift:
Start with a streaming test campaign alongside cable
Compare performance metrics
Gradually increase streaming allocation
Reduce cable as streaming proves effective
Rather than buying individual streaming services, use platforms that aggregate inventory:
Benefits:
Single buy reaches multiple services
Simplified management and reporting
Access to inventory across the streaming ecosystem
Often better CPMs than direct buys
Adwave provides access to 100+ premium streaming channels, solving the fragmentation challenge with a single campaign.
Many streaming viewers are cord-cutters or cord-nevers who cannot be reached through cable:
Cord-cutter advertising tactics:
Focus on streaming-only platforms
Target younger demographics
Emphasize digital-native messaging
Use streaming's geographic targeting
Traditional TV still makes sense in specific situations:
When cable/broadcast makes sense:
Major local events (local news, sports)
Reaching older demographics specifically
Very large local budgets seeking maximum reach
Specific programming partnerships
When streaming is better:
Younger audiences
Precise geographic targeting
Flexible budgets
Measurable performance goals
Streaming TV works best as part of an integrated marketing approach:
Sequential messaging: Use streaming for awareness, digital for action
Retargeting: Follow up streaming viewers with digital ads
Consistent branding: Maintain creative consistency across channels
Measurement: Track lift across all channels
The shift from cable to streaming represents the most significant transformation in television since the advent of cable itself.
The pandemic accelerated streaming adoption dramatically:
2020: Stay-at-home orders drove streaming trial
2021: Habits formed during pandemic persisted
2022-2023: Streaming services added content, users stayed
2024: Ad-supported tiers launched widely
2025: Streaming crosses historic 45% threshold
What might have taken a decade occurred in five years. The transformation is essentially complete. Streaming is now the default form of television viewing for most Americans.
Industry analysts project continued streaming growth:
2025-2026: Streaming likely to reach 50% share
Cable: Expected to continue decline to 15-18%
Broadcast: Stable at 18-22% (protected by sports, news)
Advertising shifts: CTV ad spending growing 15-20% annually
The question is no longer whether streaming will dominate but how advertisers will adapt to a streaming-first television landscape.
For local businesses, the streaming shift is particularly significant:
Traditional local TV (cable/broadcast):
Historically the only TV option for local advertisers
Required substantial budgets
Limited targeting (DMA-level only)
Declining reach as viewers leave
Streaming local advertising:
Precise geographic targeting (ZIP code level)
Lower budget minimums
Growing reach as viewership increases
Better measurement and attribution
The combination of growing streaming viewership and accessible advertising platforms means local businesses can now execute effective TV advertising campaigns that would have been impossible just a few years ago.


Industry analysts have noted the significance of the cable-to-streaming shift.
StreamTV Insider reported that "streaming accounted for 44.8% of all TV viewing in the US in May, according to Nielsen, narrowly surpassing for the first time the combined monthly usage of broadcast and cable television." The publication noted this milestone as a turning point in television history.
Hollywood Reporter's analysis observed that "the gains for streaming came largely at the expense of cable, which came in at 22.2 percent of TV use for the July reporting period." This highlights that cable, not broadcast, has borne the brunt of streaming's rise.
AmbioEdu's research confirmed that "streaming surpassed cable and broadcast in total viewing time in 2024 and continues to dominate in 2025. Over 40% of all TV time is now spent on streaming platforms."
The consensus view is that streaming's dominance is permanent and growing. Advertisers who fail to adapt risk reaching shrinking audiences at increasing cost while missing the growing majority of viewers.
Cable isn't dying immediately, but it's in sustained decline. Viewership has dropped from 35%+ to about 22% of total TV viewing in just a few years, and the trend continues. Cable retains strength in sports and news, but even those advantages are eroding as streaming services acquire sports rights. For advertisers, cable still offers some reach, but declining audiences mean it should be supplemented with streaming.
Streaming first surpassed cable as the single largest category of TV viewing in July 2022, when streaming captured 34.8% versus cable's 34.4%. In May 2025, streaming (44.8%) exceeded the combined total of cable (24.1%) and broadcast (20.1%) for the first time. The trend has been consistent and accelerating.
Not necessarily, but you should evaluate whether cable still reaches your target audience. If you're targeting viewers over 55, cable may still be relevant. For most businesses targeting younger or broader audiences, shifting budget toward streaming makes sense. Consider testing streaming alongside cable, measuring results, and adjusting allocation based on performance.
Streaming offers better targeting (ZIP code, demographic, behavioral), more flexible budgets (minimums as low as $50), and better measurement. Cable offers lower CPMs but less precise targeting and declining audience. For most small businesses, streaming's targeting advantages outweigh cable's lower CPMs because you're paying to reach only relevant audiences.
As of 2025, streaming represents approximately 44-47% of total U.S. TV viewing, varying by month. This is the largest share of any category and continues to grow. Cable represents about 22% and broadcast about 20%, with the remainder split among other sources like gaming and DVD playback.
Key statistics on cable vs. streaming viewing:
44-47%: Streaming share of total TV viewing (2025)
22-24%: Cable share of total TV viewing (2025)
20-21%: Broadcast share of total TV viewing (2025)
44.8%: Historic streaming share in May 2025
12-13%: YouTube's share of total TV viewing
7-8%: Netflix's share of total TV viewing
18 pts: Streaming share gain since 2021
13 pts: Cable share loss since 2021
$50: Minimum streaming ad budget on accessible platforms
100+: Streaming channels accessible via aggregated platforms
Data sources:
The shift from cable to streaming isn't coming; it's already here. Your customers are increasingly watching streaming television, and that's where your advertising should be.
Adwave makes streaming TV advertising accessible for businesses of all sizes. Create a professional TV commercial in minutes with AI, target your specific market, and launch across 100+ premium streaming channels starting at just $50.