Ready in minutes
AI builds your ad from a single prompt

Expert insights and analysis on TV advertising trends and best practices.
insights
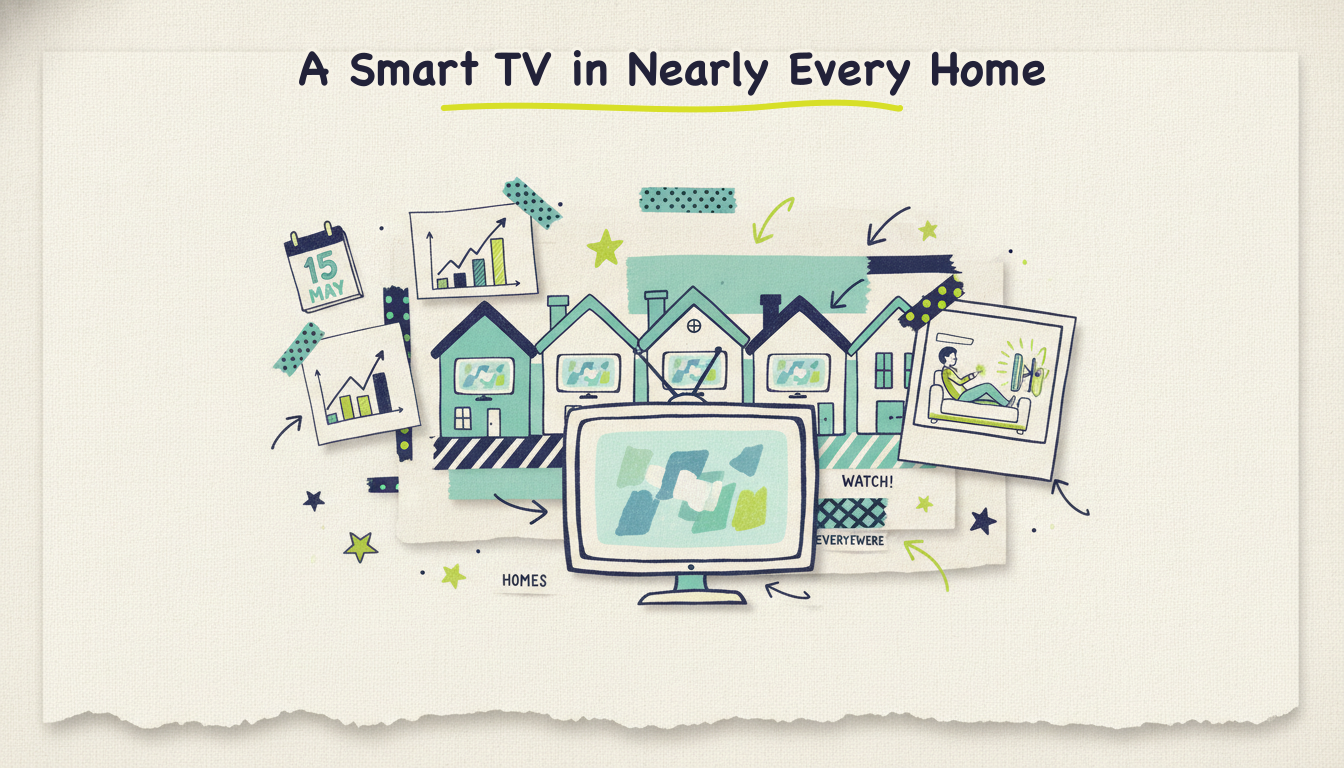
Roughly 90% of U.S. TV households now have a connected TV device and 243M+ Americans will watch CTV in 2026. What near-universal smart TV penetration means for small business ads.
insights
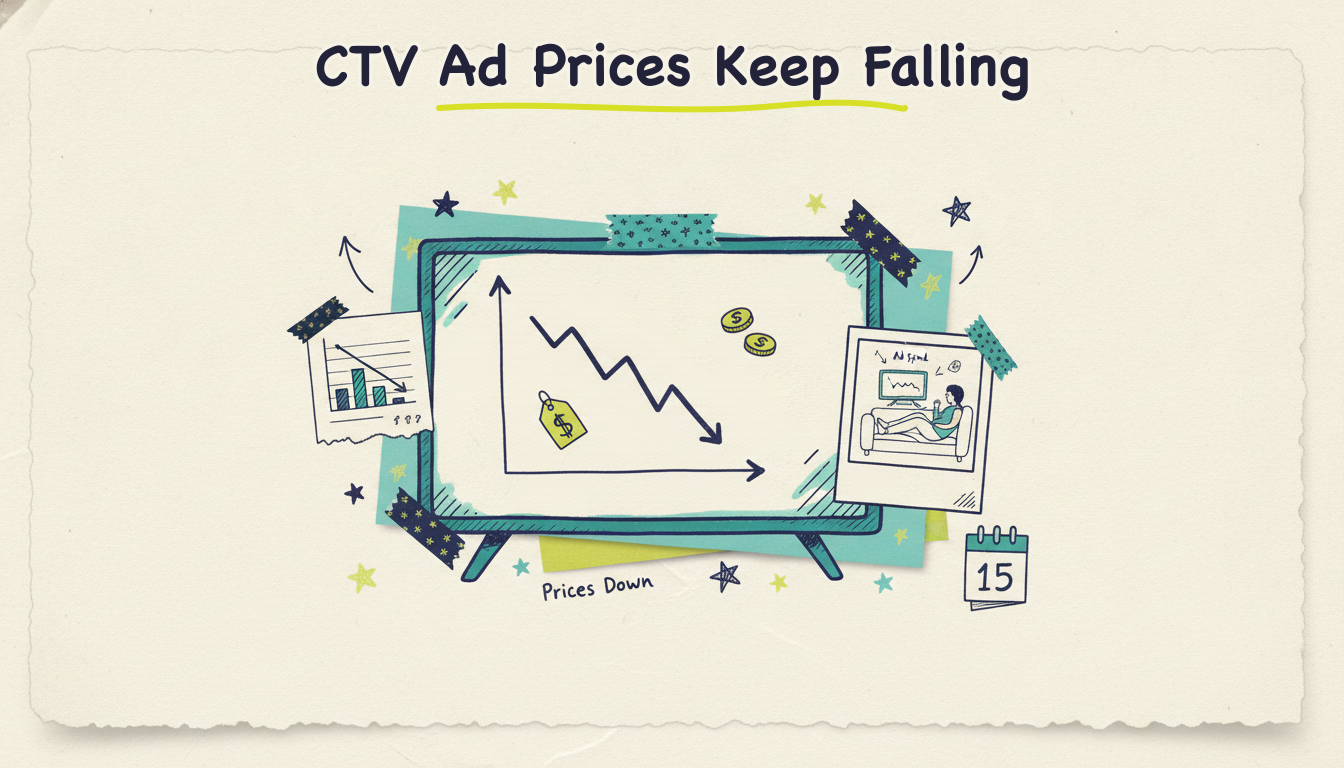
The blended CTV CPM is about $26 in 2026 and dropping as streaming inventory floods the market. What connected TV ads cost by tier and what a $500 budget buys.
insights
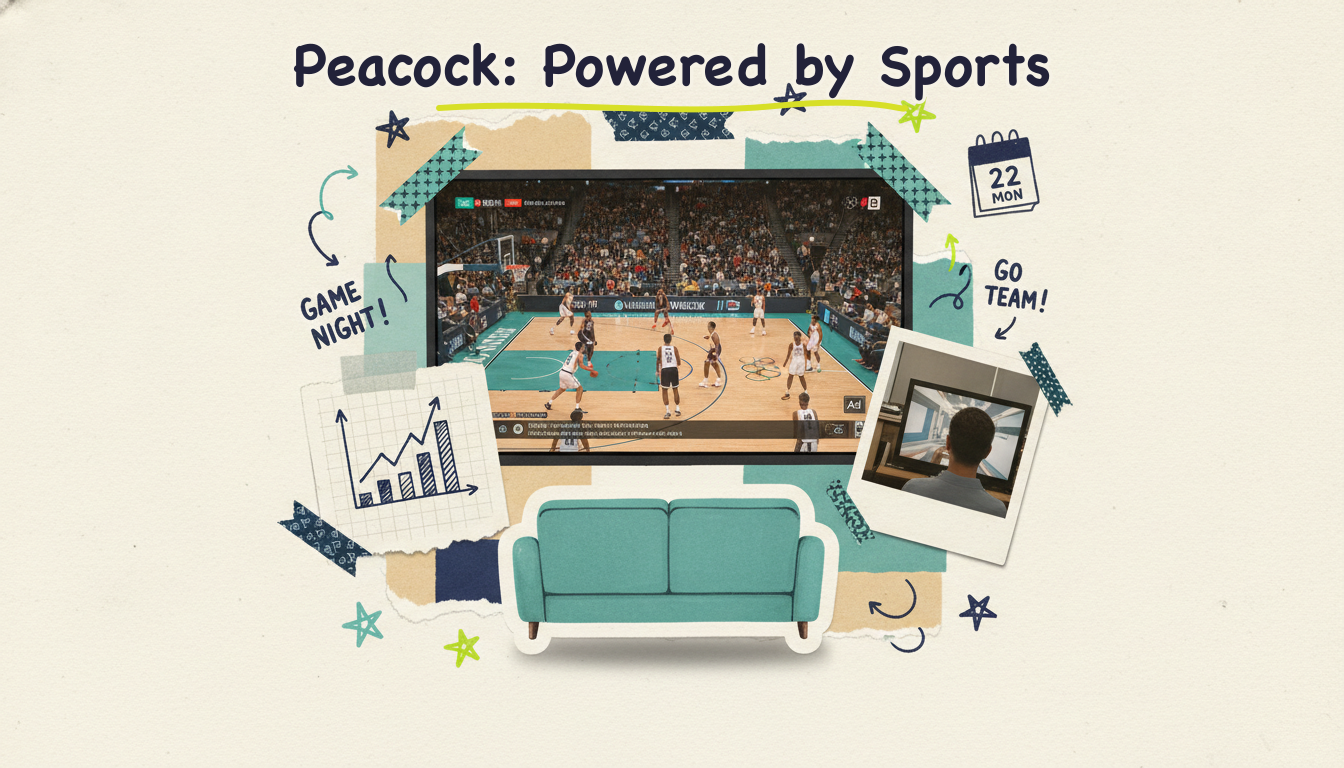
Peacock hit 1.2% of U.S. TV viewing in April 2026, spiking to 3.0% around the Super Bowl and Olympics. Its 46M subscribers, NBA deal, and what its ad-supported audience means for SMBs.
insights
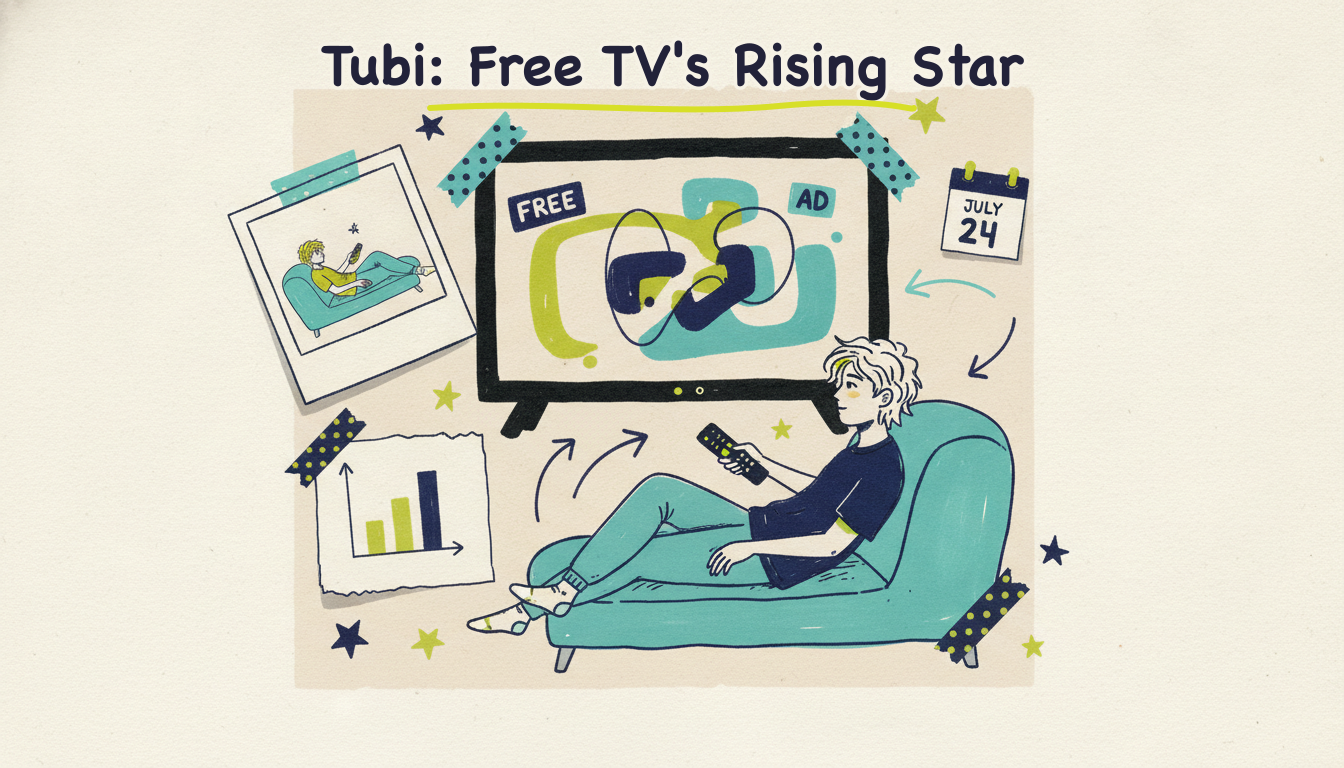
Tubi reached a platform-best 2.3% of U.S. TV viewing in April 2026, a free service ahead of Peacock and Paramount+. Its 100M+ young, cord-cutting audience and what it means for SMBs.
insights
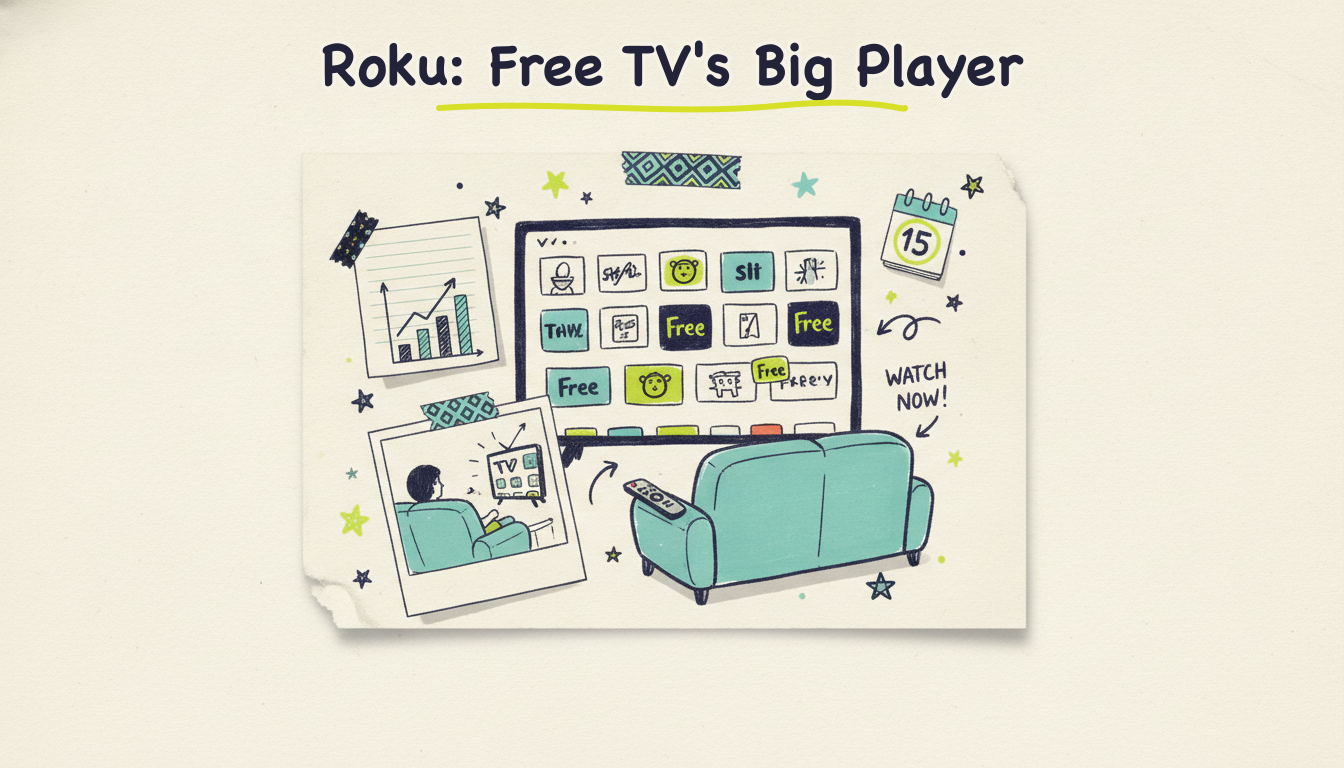
The Roku Channel is a top-five streaming service at ~3% of U.S. TV viewing, while 21% of all TV runs through Roku devices. Why Roku is one of the most SMB-accessible CTV platforms.
insights
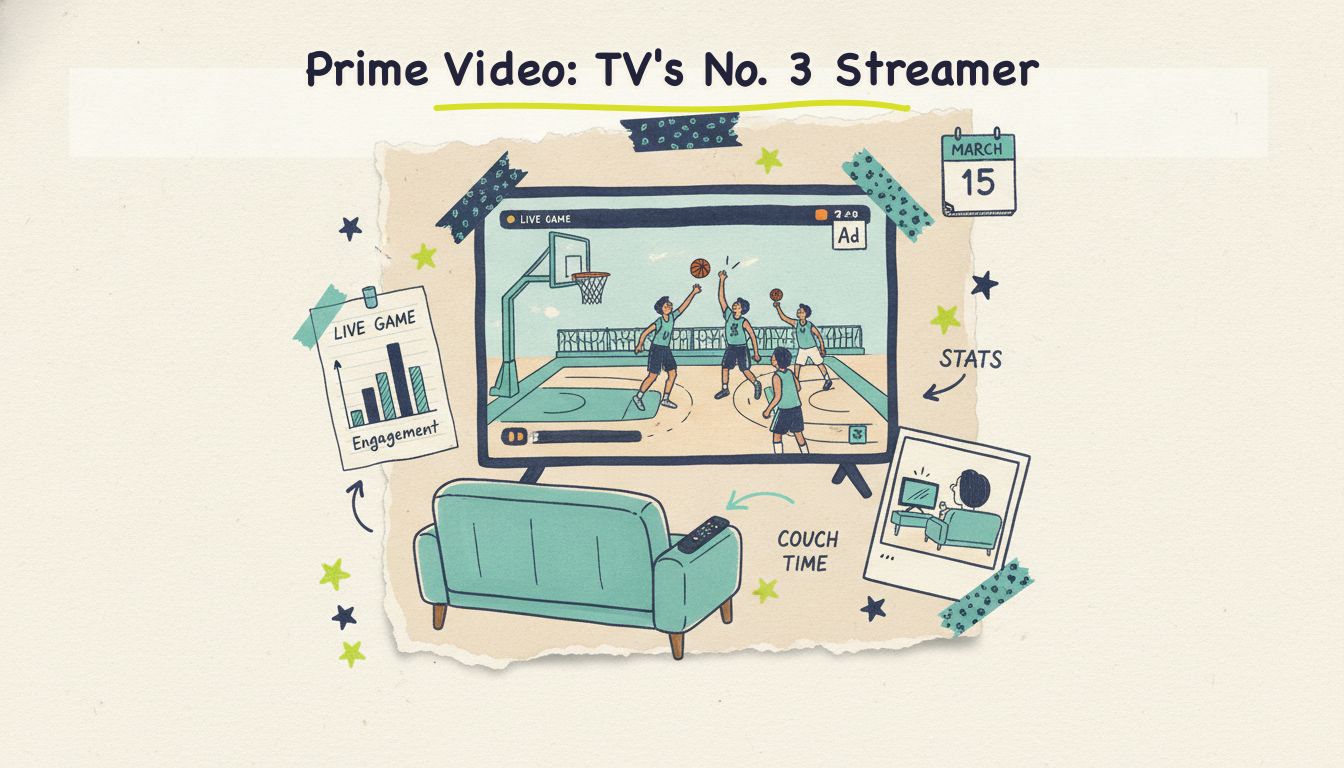
Prime Video is the #3 streaming service at 4.2% of U.S. TV viewing, up 0.7 pts on NBA and NFL. Its 315M ad audience and what it means for small business advertising.
insights
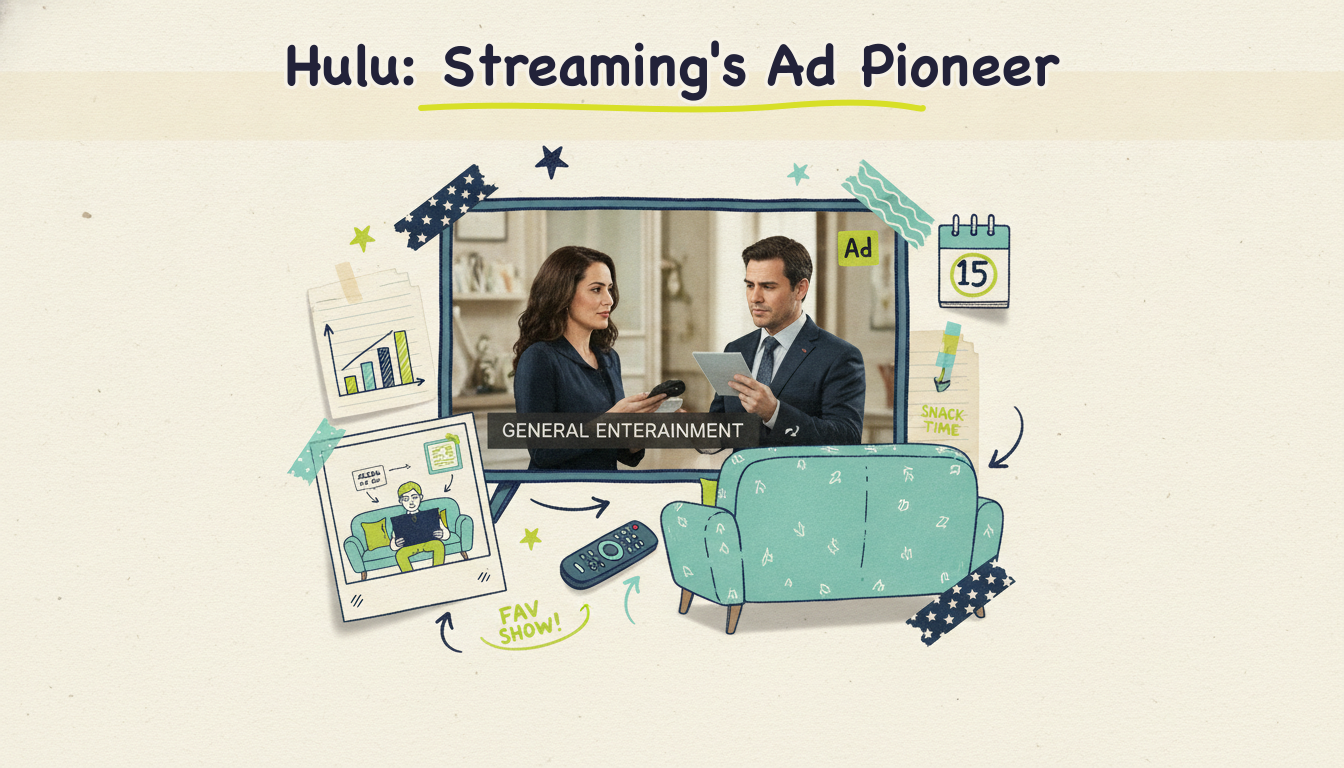
Nielsen now folds Hulu into Disney's ~5% combined streaming bucket; its last standalone reading was 2.5%. Hulu's ~64M subscribers and what its ad-supported audience means for SMBs.
insights
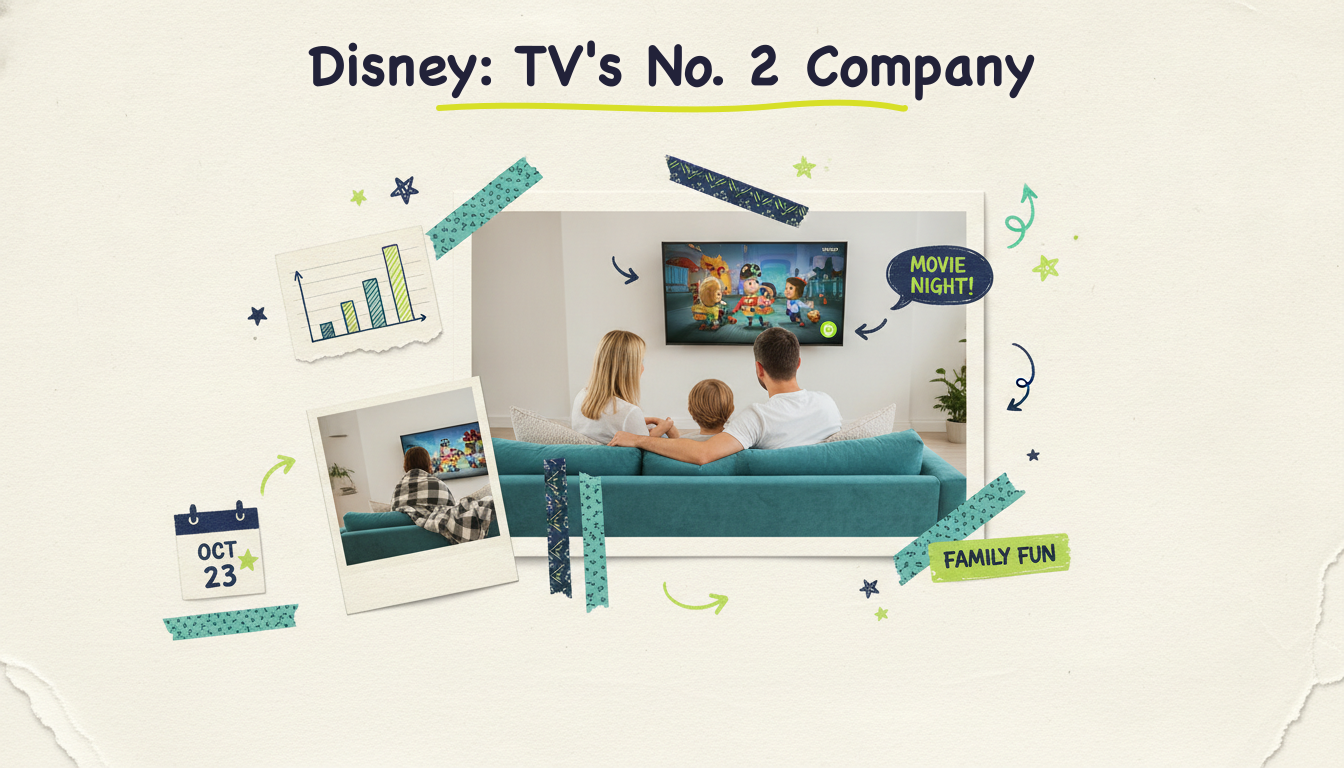
Disney is the #2 media company on U.S. TV at 10.3%, with combined streaming near 5%. The Q2 2026 breakdown and what Disney's ad-supported reach means for small business.
insights
Non-pay-TV households now outnumber pay-TV homes in 2026, with penetration down to ~42%. The Q2 2026 cord-cutting breakdown and what it means for local advertisers.

insights
The U.S. CTV ad market reaches nearly $38 billion in 2026, and 85% of small advertisers are now in. What the Q2 2026 numbers mean for small business advertising.