
Adwave resources
Insights & Trends · Page 10
Expert insights on TV, social, search, and multichannel advertising for small businesses. - Page 10
219 resources

How AI Is Changing Small Business TV Advertising in 2026
AI removed TV's supply chain: production, agencies, media buying, and minimums. The five shifts reshaping small business TV in 2026, plus the honest list of what AI still can't do.
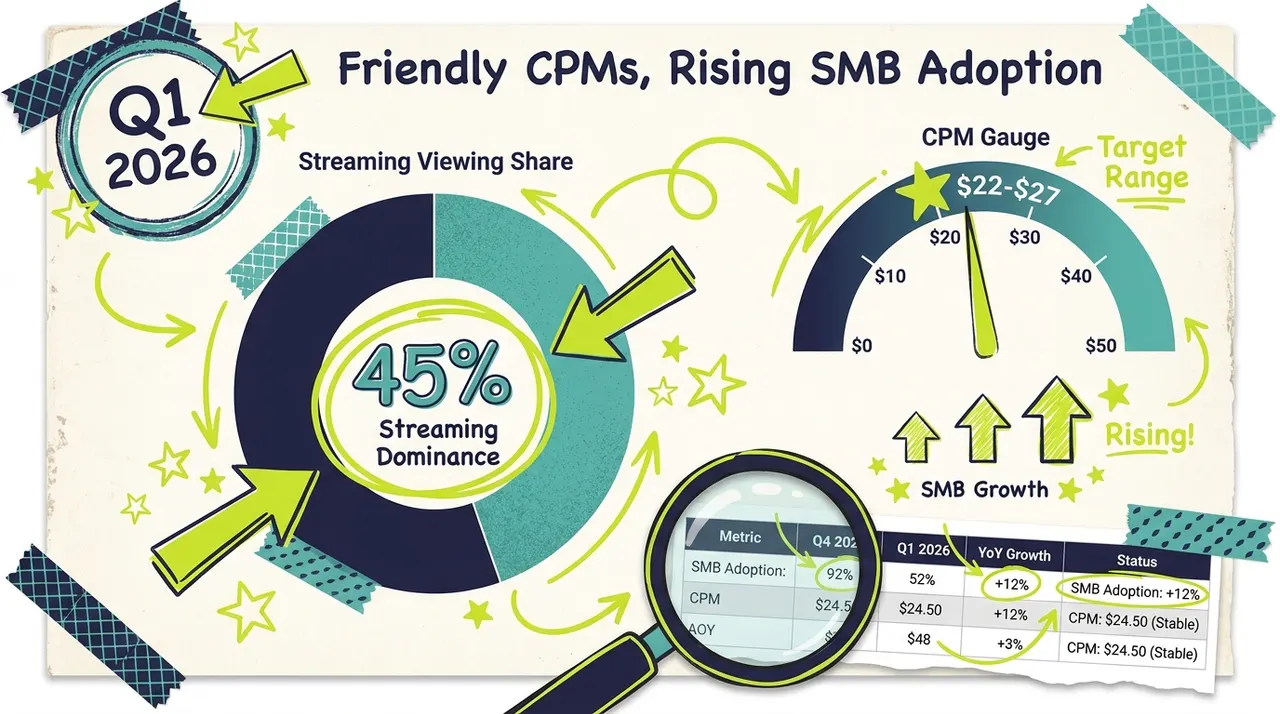
Q1 2026 CTV Market Report: Trends for Small Businesses
A Q1 2026 CTV market read for small business advertisers, covering streaming viewing share, friendly CPMs, accelerating SMB adoption by category, and the political ad pressure a...
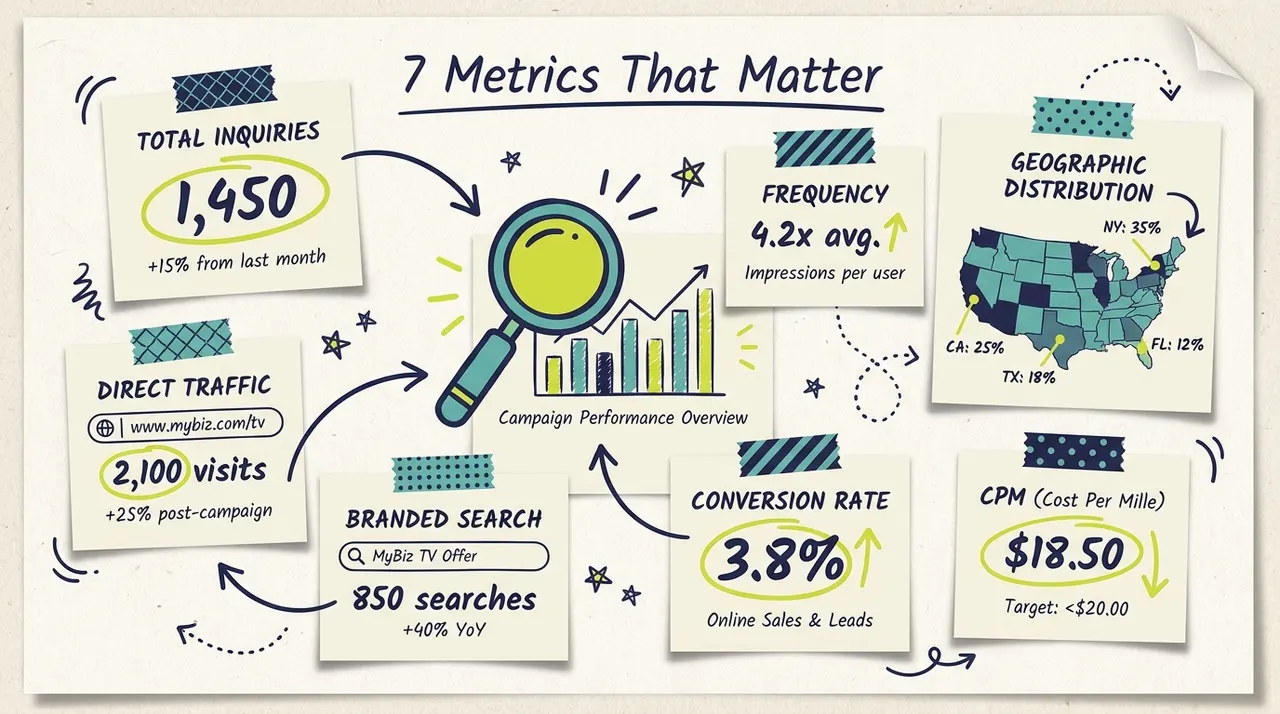
Small Business TV Campaign Metrics: What to Track
The seven core metrics that drive small business TV campaign decisions, plus a 15-minute weekly review framework and the dashboard numbers worth ignoring.

2026 Summer Advertising Trends for Small Business
Eight summer 2026 advertising trends reshaping small business plans, from friendlier CTV inventory to holiday-pegged campaigns, multi-channel coordination, and local-first creat...
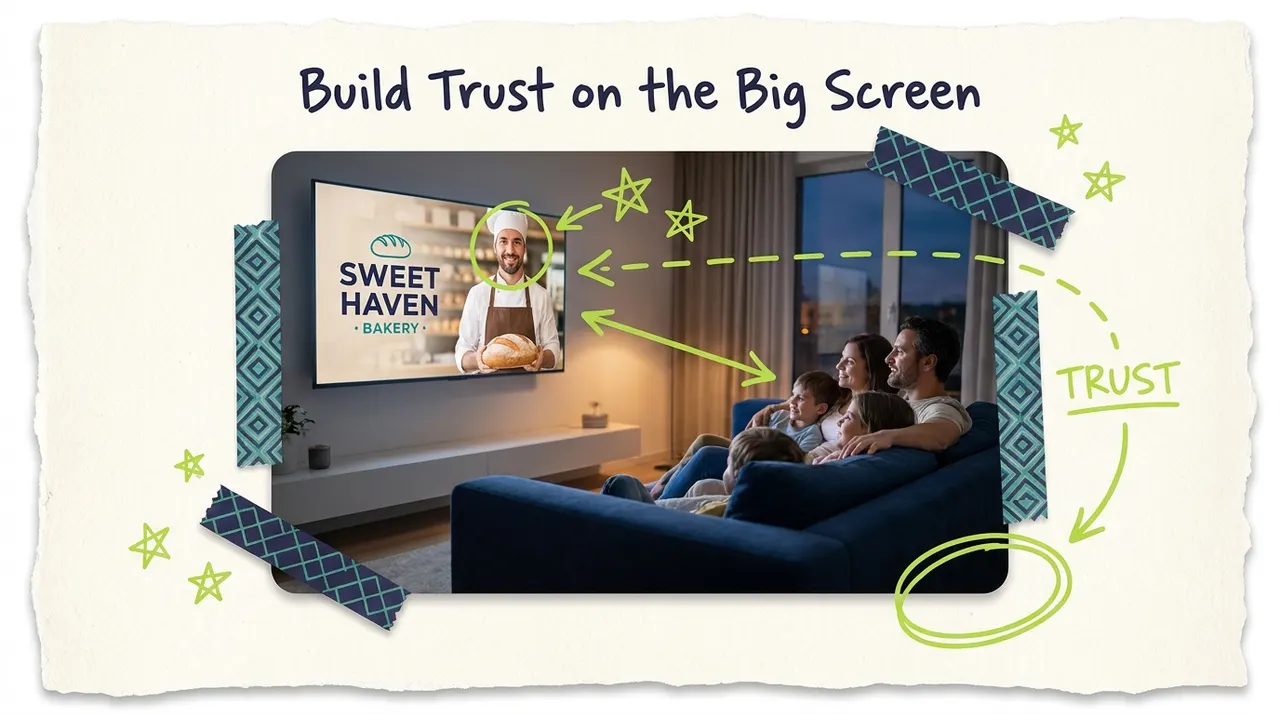
The Psychology of TV Advertising: Trust Effect
TV builds trust faster than any digital channel for small businesses. Inside the cognitive science of lean-back attention, premium context, mere exposure, and the household witn...
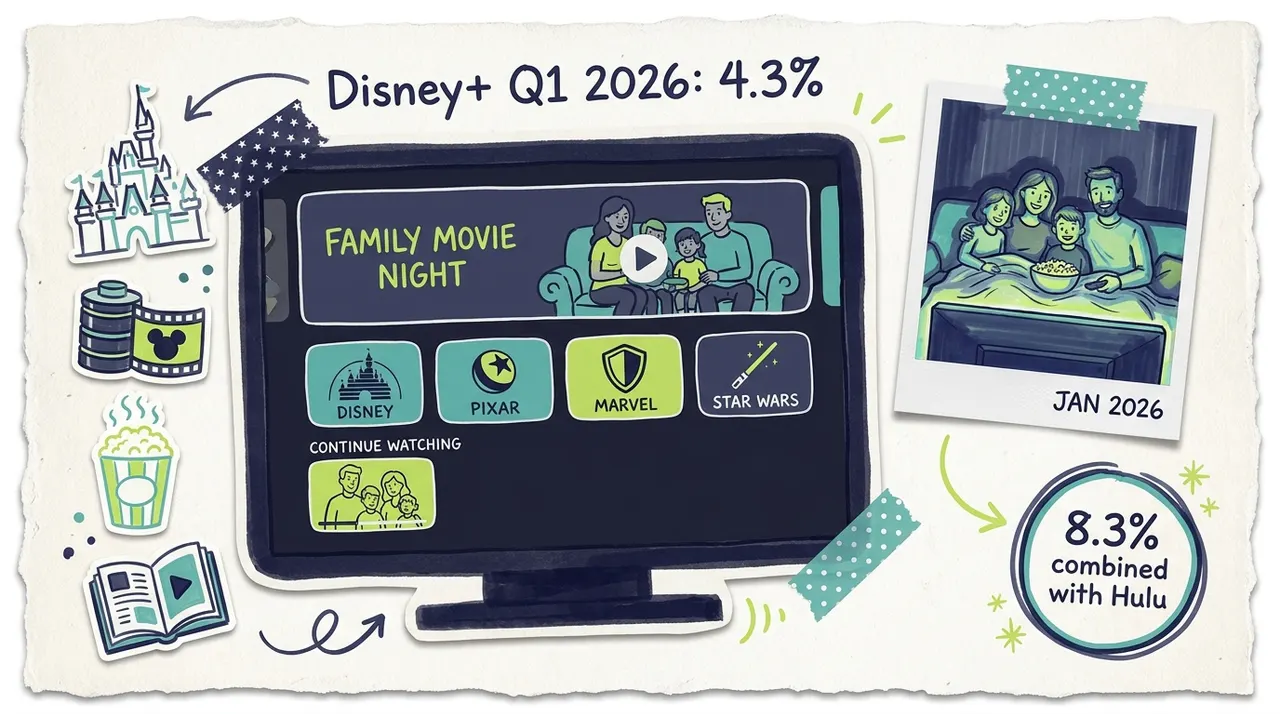
What is Disney+'s share of TV viewing? (Q1 2026)
Disney+ held 4.3% of U.S. TV viewing in January 2026, with combined Disney+Hulu reaching 8.3% (third behind YouTube and Netflix). Q1 2026 data and what it means for local advert...
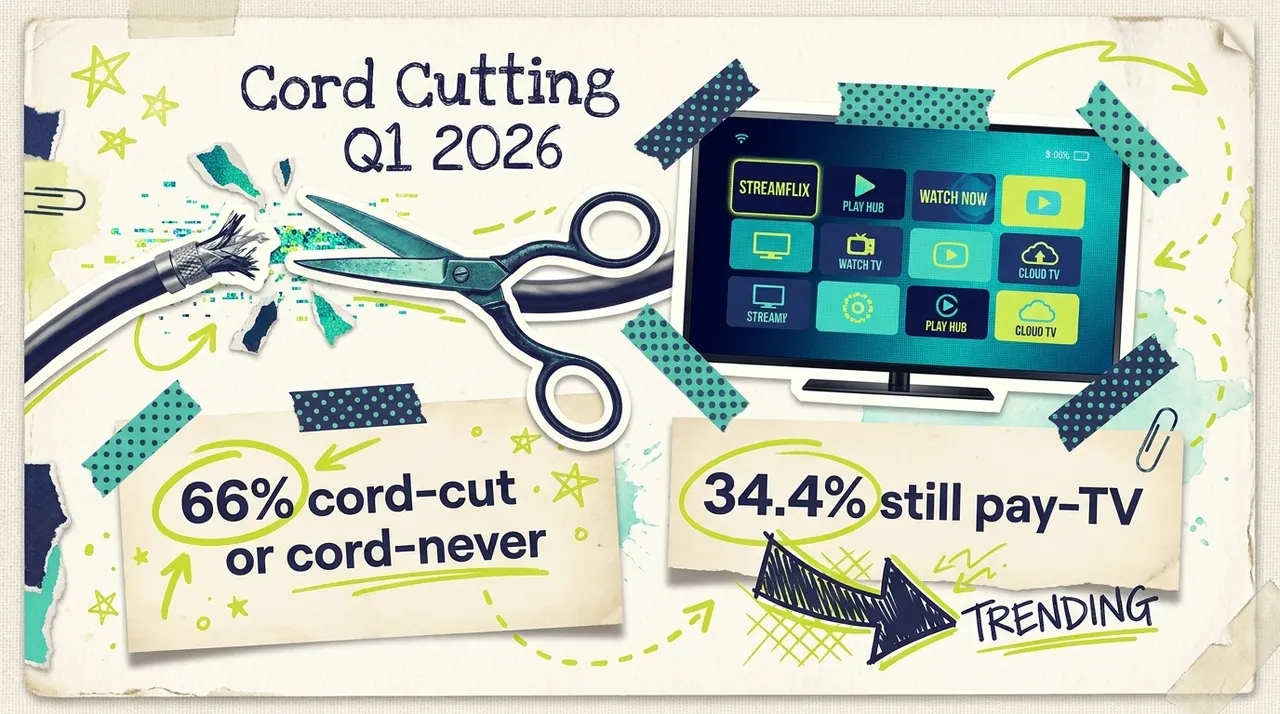
How many Americans have cut the cord? (Q1 2026)
Only 34.4% of U.S. households still subscribe to traditional pay-TV. 5 million cut the cord in 2025 alone. Q1 2026 breakdown and what it means for local advertisers.
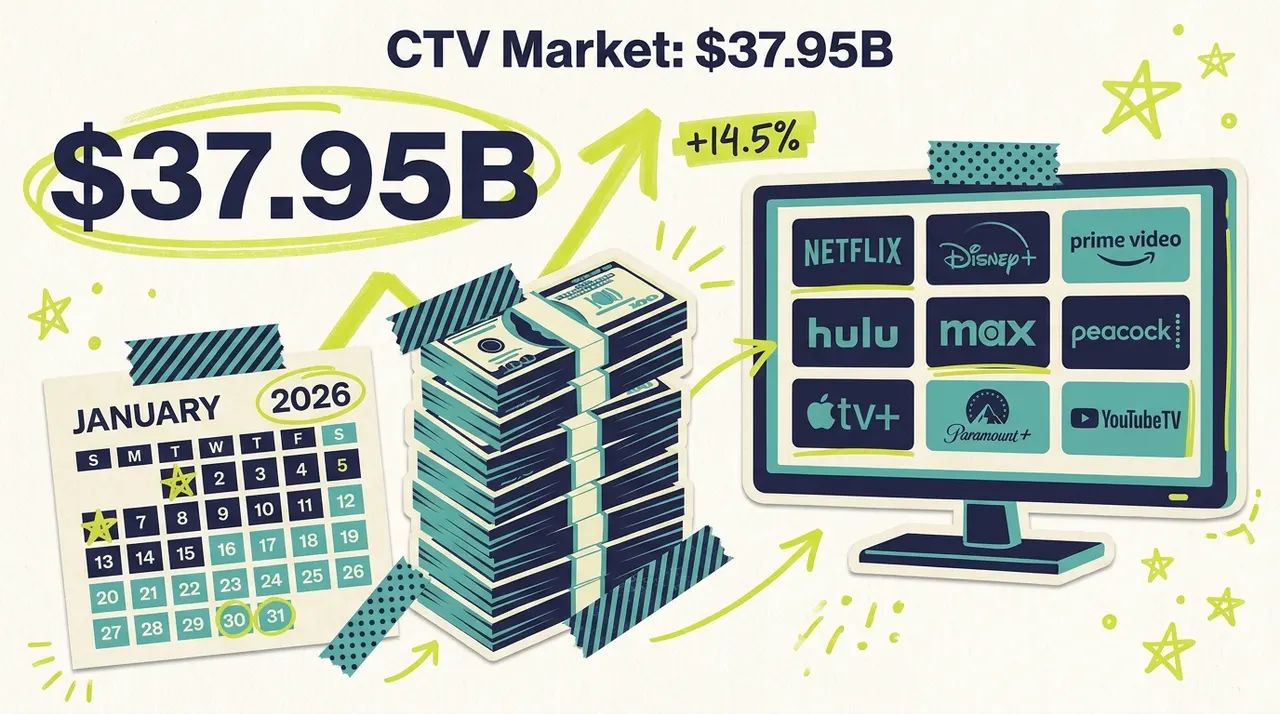
How big is the CTV advertising market? (Q1 2026)
U.S. CTV advertising will reach $37.95 billion in 2026, up 14.5% year-over-year per eMarketer's December 2025 forecast. Breakdown, drivers, and what it means for small business ...
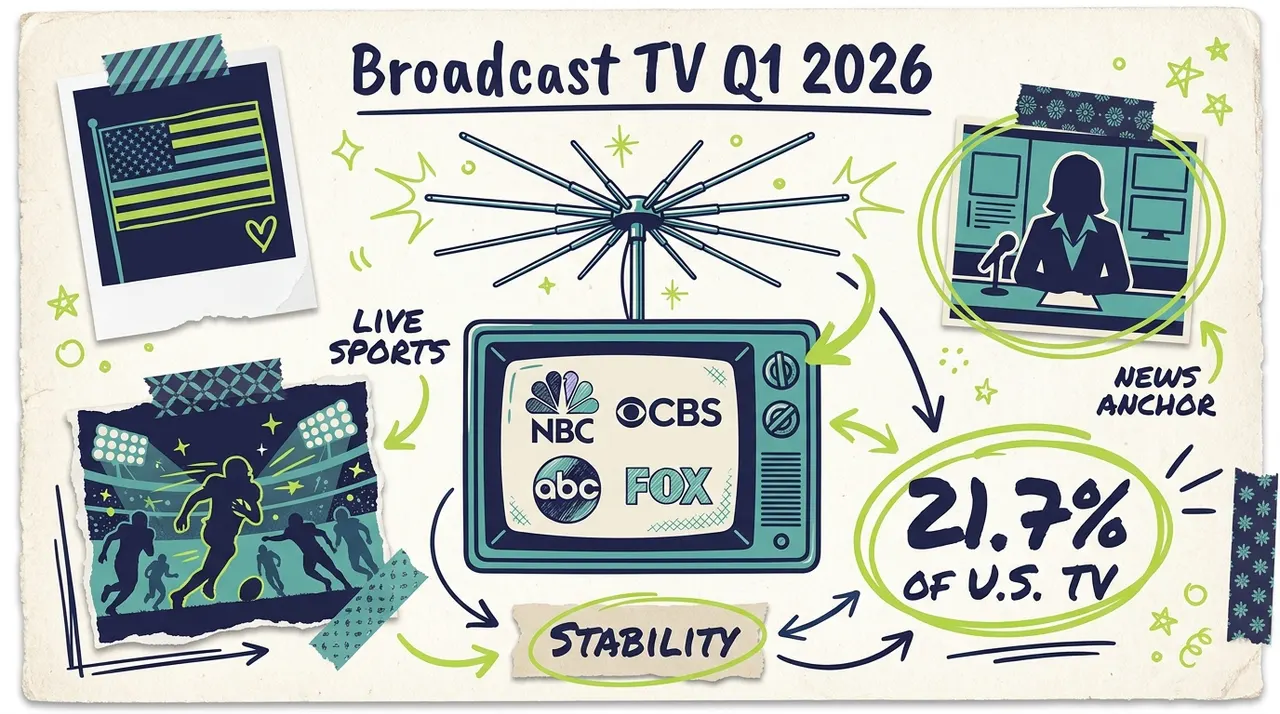
What is broadcast TV's share of viewing? (Q1 2026)
Broadcast TV held 21.7% of U.S. TV viewing in February 2026, boosted by Super Bowl LX and the Winter Olympics. Q1 2026 data and what it means for local advertisers.
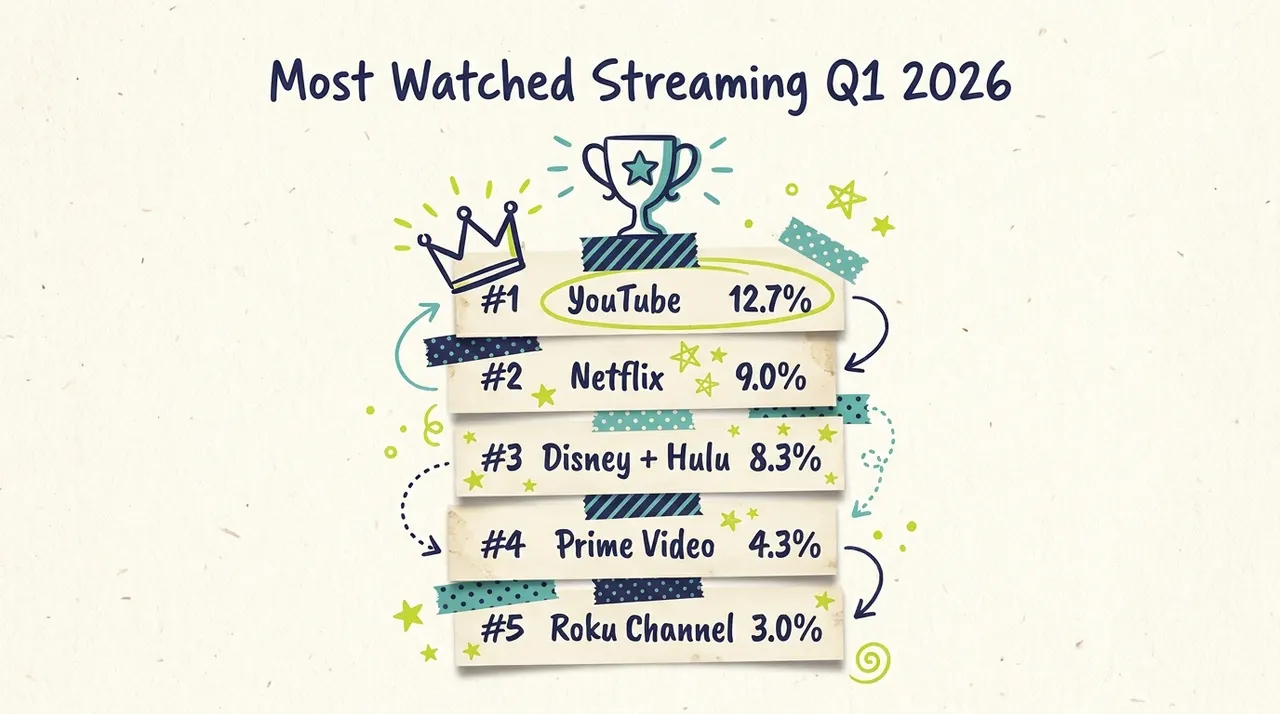
Which streaming service has the most viewers? (Q1 2026)
YouTube leads U.S. streaming at 12.7% of TV viewing in Q1 2026, followed by Netflix at 9.0% and Disney at 8.3%. The full ranking and what it means for local advertisers.
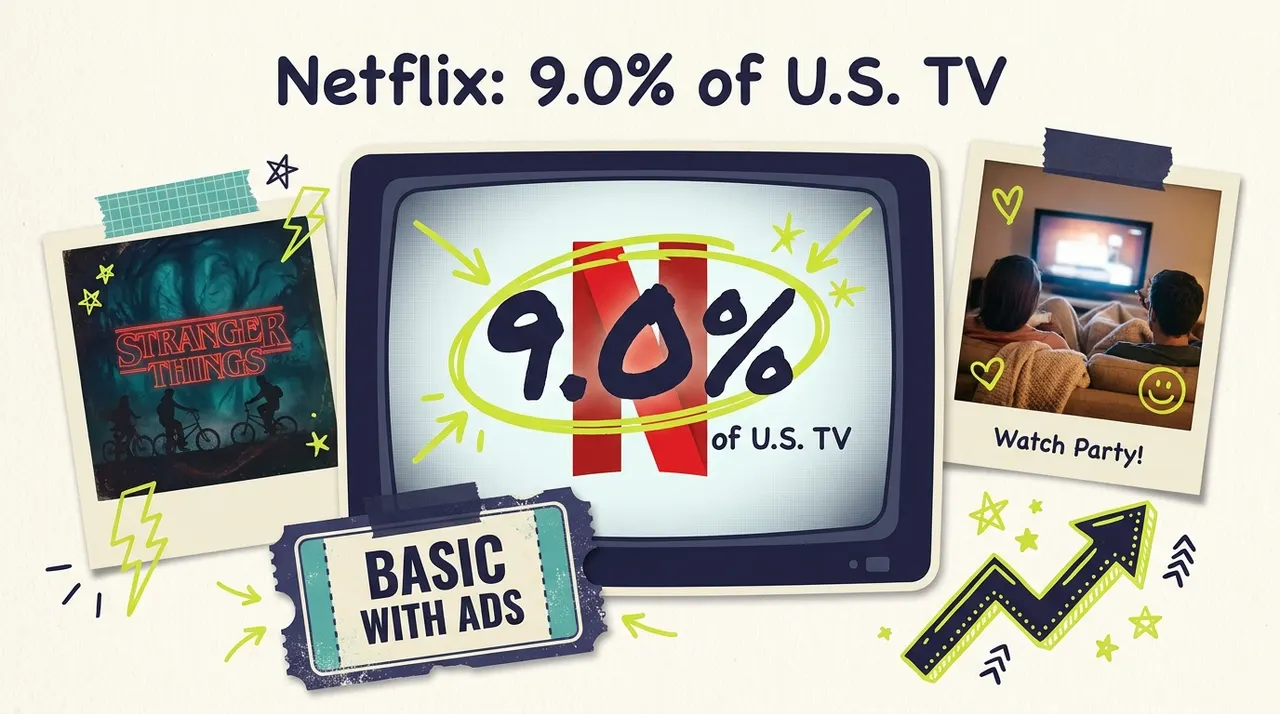
What is Netflix's share of TV viewing? (Q1 2026)
Netflix held 9.0% of U.S. TV viewing in January 2026, second only to YouTube. Q1 2026 data, the rise of the ad tier, and what it means for small business advertising.
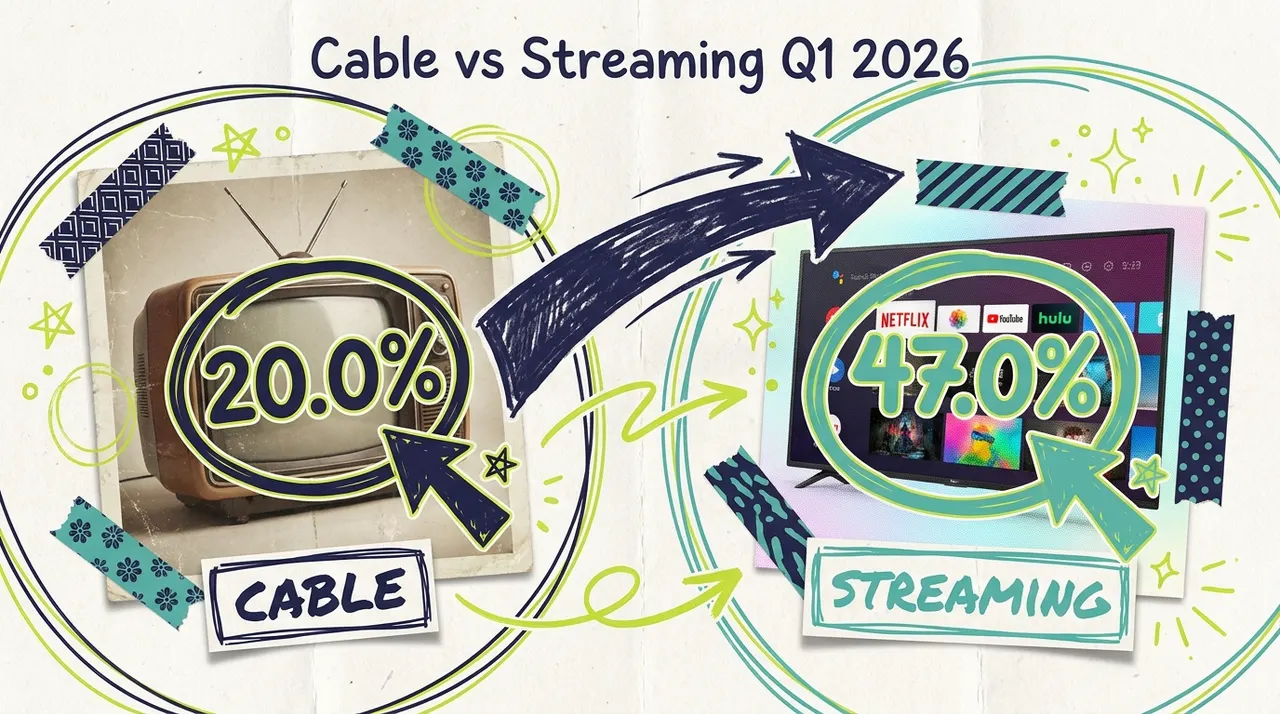
How much TV viewing is cable vs streaming? (Q1 2026)
Streaming hit a record 47.0% of U.S. TV viewing in January 2026 while cable sank to 20.0% in February. The full Q1 2026 breakdown and what it means for local advertisers.